|
This article first appeared on my new website StockEthos.com I love PayPal (PYPL). I love the stock, I love the company, and I love its ethos. I also love to trade it. In the past I’ve written about PayPal from a teenager’s perspective, citing the company’s strong appeal to my generation. I won’t be delving into the company’s fundamentals in this post (if you’d like a fundamental analysis, please read the article linked above), but I maintain that PayPal deserves a spot in every longterm portfolio. However, for those with a shorter term outlook — or those who would like to trade around a core position — I think there is a lot of money to be made in PayPal in a relatively short period of time. PYPL trades at $39 at the time of writing, and I believe that the stock can retest its all-time high of $42. Why do I think that PayPal can retest its highs? Take a peek at the chart below, which I’ll break down piece by piece. 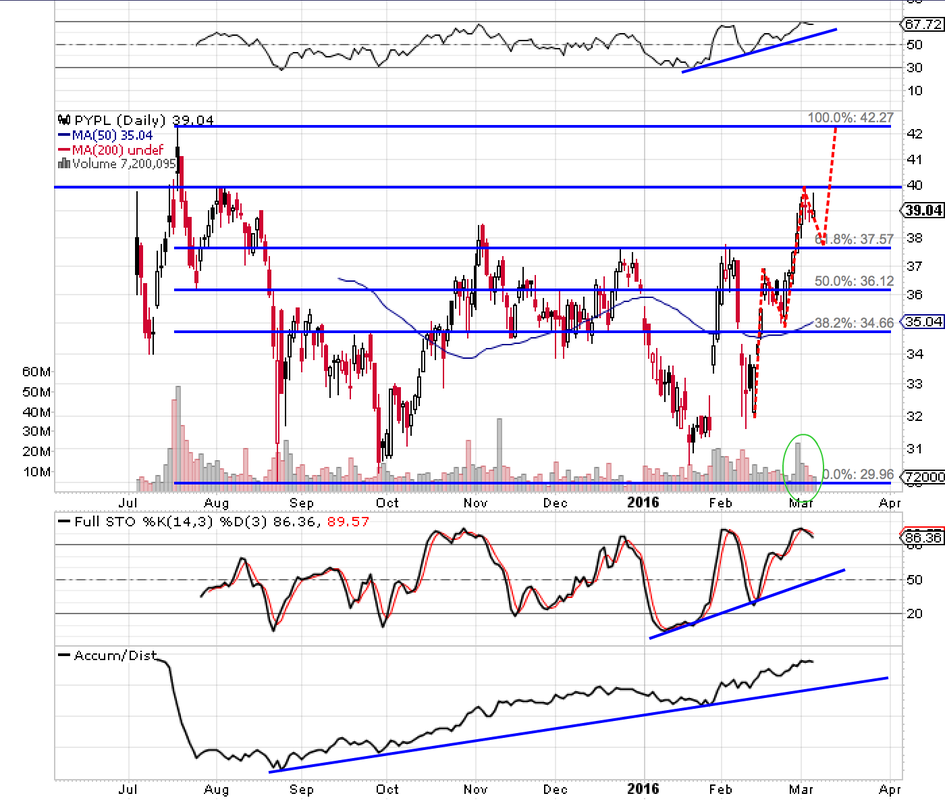 Paypal has seen incredible symmetry over the last three weeks. I show this symmetrical price movement via red dotted lines that are superimposed on the chart. In mid-February, PYPL rallied from $32 to $37 in four trading days. Then, over the course of six trading days PYPL declined from $37 to $35. The $32 to $37 move is a difference of $5, and the decline from $37 to $35 is a $2 price differential. In the last days of February, PYPL rallied again from $35 to $40. Like the previous move higher, the stock rallied $5 in four trading days. The stock touched $40 on March 1, and has since pulled back to $39 over the last three days. I believe that we will see the same symmetry play out, which would mean that PYPL should decline by $2 from its high. This means that the stock should bottom at $38 before moving higher once more. What else supports my belief that PYPL will pivot higher from a base of $38? A few things. The first is the 61.8% Fibonacci retracement level that currently sits at $37.6. While this would not be a move of exactly $2 (it would be $2.4), in my eyes it’s close enough to call it symmetry. This important Fibonacci retracement level was resistance on the way up, so it will become support on the way down. Moreover, PYPL is due for a small pullback. Stocks don’t go up or down in a straight line; they need time to consolidate and regroup. The RSI and Stochastics indicators both suggest that the stock is overbought, but they are each trending higher. In addition, the accumulation/distribution line recently went rather parabolic, but has been making higher highs and higher lows for months. This implies that there is a strong bias for the bulls. I wouldn’t be surprised to see a test of the trend lines on all three indicators. If the symmetry holds true, PYPL still has two-to-three more days of consolidation before finding support. I believe that the symmetry and a retest of support on the three indicators would coincide with a $38 handle in the stock, which triggers your buy signal. The above technical analysis is further supported by the stock’s volume (read: Why Volume Is Important In Technical Analysis), which indicates that PYPL is consolidating into a bull flag. A bull flag forms when a stock breaks out on above-average volume, and then declines on below-average volume. This suggests that the selloff is largely the result of some profit taking and that most investors want to hold onto their shares. Lastly, allow me to share how I arrived at my price target of $42. Although $42 wouldn’t signify perfect symmetry, I believe that the stock will see substantial resistance at this level. Perfect symmetry would mean that the stock pushes higher to $43 per share — which can happen — but I don’t think that it will come in a straight shot. It’s worth noting that there is decent resistance at $40, but if PYPL can clear this hurdle then $42 should come very easily. If the trade goes sour and the stock can’t find support at $38, then your max risk should be $2 to the downside. There is support at $36 because that’s the price at which the 50% Fibonacci retracement level lies. This sets up a risk/reward of at least 2:1 for this trade, making it one that you should definitely consider being a part of.
0 Comments
We're in for a short-term rally. As in a rally that will last, at most, two or three weeks (in my opinion). For many charts, a few weeks of upside will be enough time to shape out a right shoulder to complete their head-and-shoulders patterns. I'm urging you to take profits in the coming weeks if you've got 'em because they won't be there for long. In a month we'll forget that this rally ever existed because we'll have fallen so low. As much as bulls want to maintain their long term outlook, it just won't work with 2016's volatility. Oh, and let's not forget that most of the charts I'm seeing are a mess. Almost every single one of them. For example... Goldman Sachs (GS)? Awful. Apple (AAPL)? Terrible. 3M (MMM)? Don't get me started. Visa (V)? Vomit. Nike (NKE)? Just don't do it. My advice? Do yourself a favor and short Apple and 3M into earnings this Tuesday. I don't see a reason to be long either going into the quarter. If you have a reason, please let me know; but right now I see nothing. I'm calling for a retest of 1950 on the S&P 500 followed by a rollover to 1770. Just be patient -- I'll see you there. 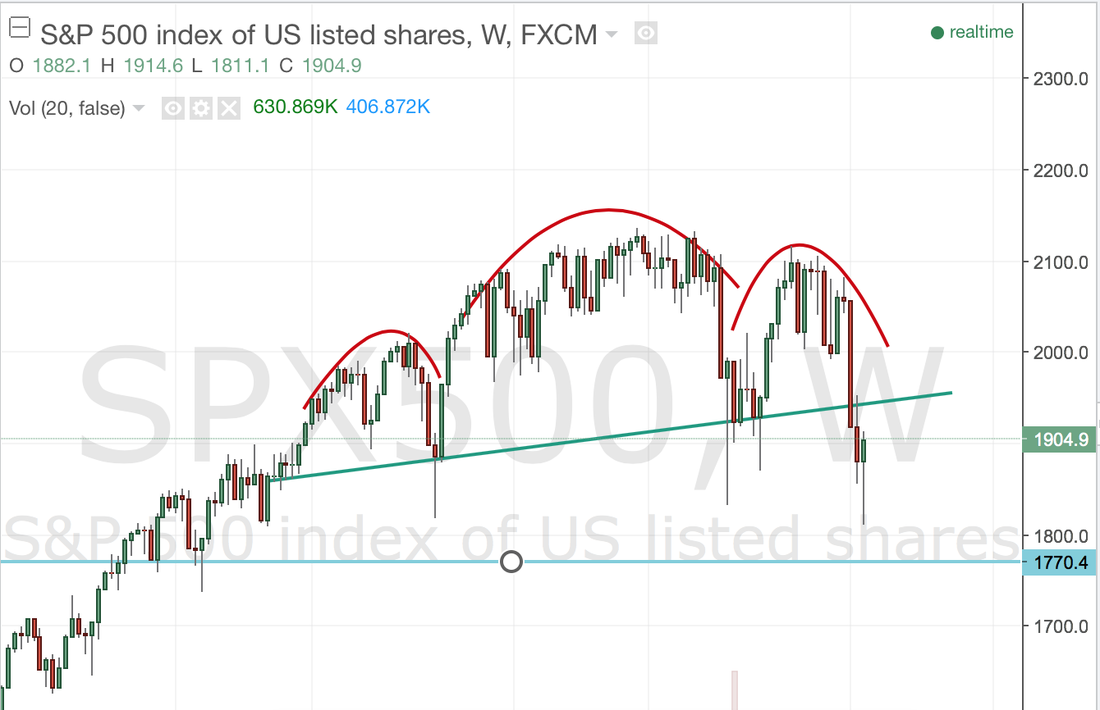 |

 RSS Feed
