|
FANG, the acronym for Facebook (FB), Amazon (AMZN), Netflix (NFLX), and Alphabet (GOOGL) (formerly known as Google) was the staple for comparison throughout 2015. These stocks were by far the best performers over the last year, with Netflix and Amazon the winningest of them all. If you put your money in any of these four stocks, you tremendously outperformed the overall markets. And, if you put your money in either of the middle two letters, you doubled your money -- and then some.
These gains are impressive and, on their own, are not a reason to sell. Just because a stock doubled in price over a 12 month period does not mean that it won't move higher in the next 12 months. In a turbulent market, the names that compose FANG are actually good places to be. The appeal of these companies is their growth, which can often maintain its trajectory in a lackluster economy.
However, it's possible that these names are becoming overheated. I'm seeing some action in three of the four FANG names that should get you a little concerned going forward. While I believe in each one of these companies in the long haul, I think the next fiscal year won't be so pretty. If you've enjoyed the ride higher, you may want to realize some of these gains and wait for better prices to reenter. I do think that these prices will come but, given the beta of these names and the overall market volatility of late, I would not be short any letter of FANG.
0 Comments
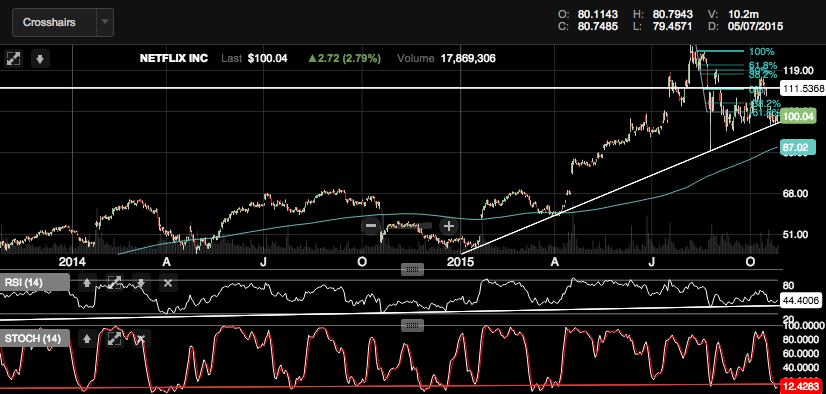 Above is a long-term daily chart of Netflix (NLFX). Superimposed is a trend line at which the stock recently found support. I think that NFLX is due for a bounce not only because of its newfound support, but also because of a few technical indicators. The relative strength index, or RSI, has been trending upward for years. If you look at the rightmost portion of the RSI, you can see that it has come close to bottoming. Also, the stochastics, located at the absolute bottom of the picture, seems to have bottomed, for it just touched a horizontal line of support. Located below is the same exact chart, just zoomed in to the last seven months for clarity. 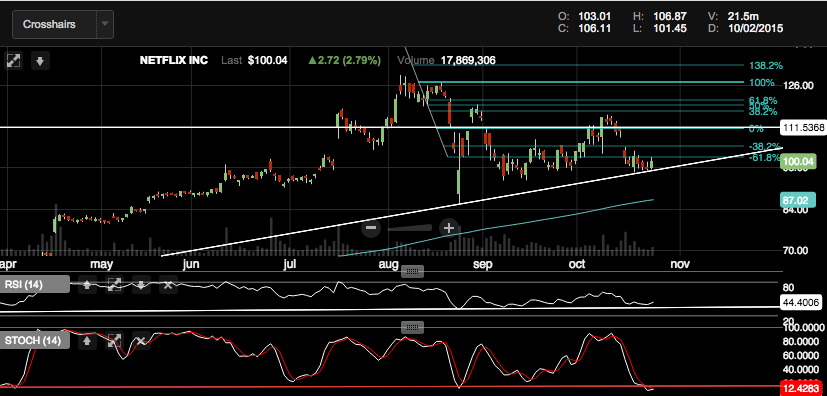 It is also worth noting that NFLX has support at $97, and near-term support at $101.5 and $105. The latter prices are resistance due to the Fibonacci retracement of -61.8% and -38.2%, respectively. I think that if you can get in at around $100, which is NFLX's price at the time of this piece, then it offers a decent risk/reward of 5/3.
|
 RSS Feed
