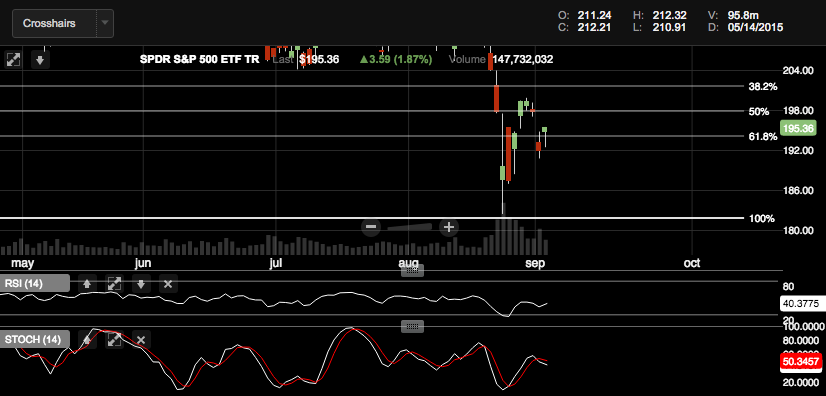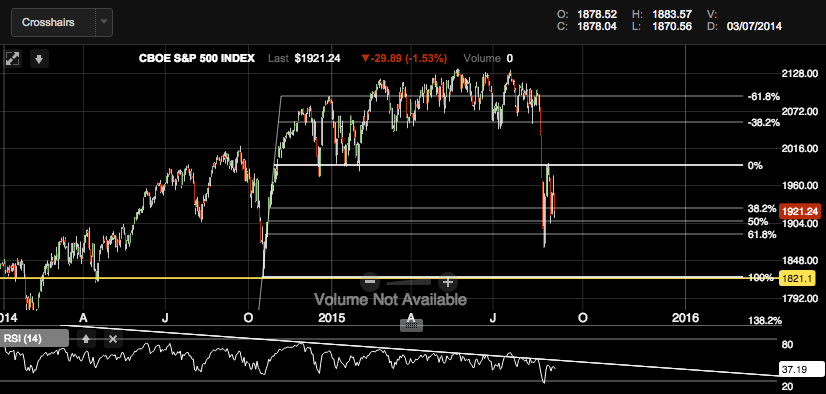
I'll make this post short and sweet, just like the recent market rally. Firstly, I'm mad at myself for not catching the RSI diverging from the broader market (pictured above). When the RSI is not moving in unison with the trend of a stock or the market as a whole, then odds are that a reversal is about to take place. Since October, the RSI has been making lower highs and lower lows, while the S&P 500 - and the Nasdaq and Dow Jones Industrials - have been making higher highs and higher lows. This is only sustainable for so long, and shows that perhaps what you're seeing is a facade.
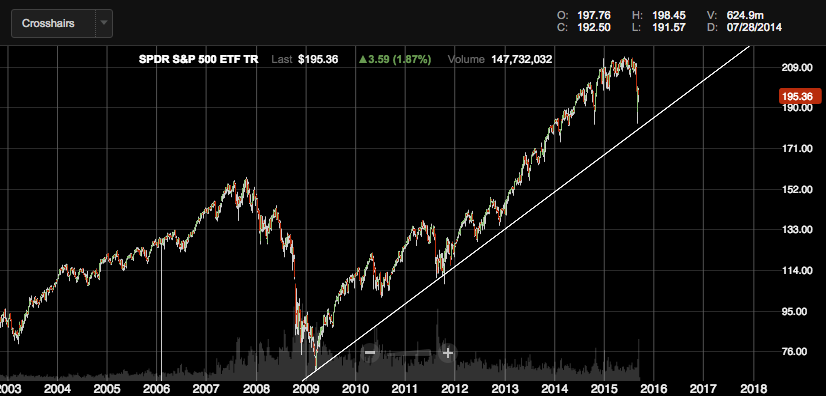
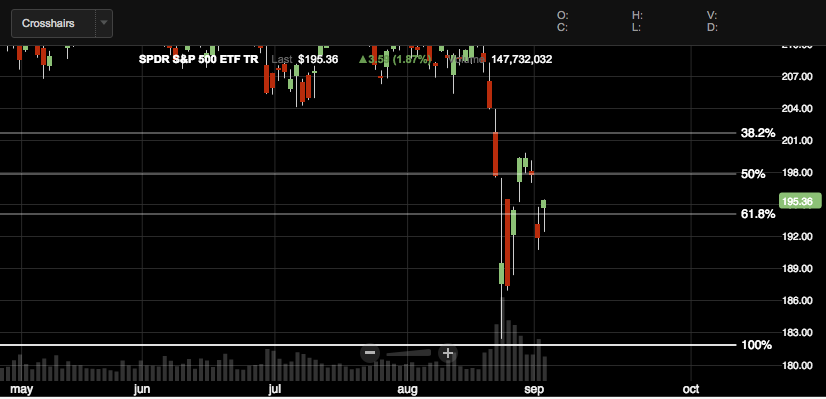
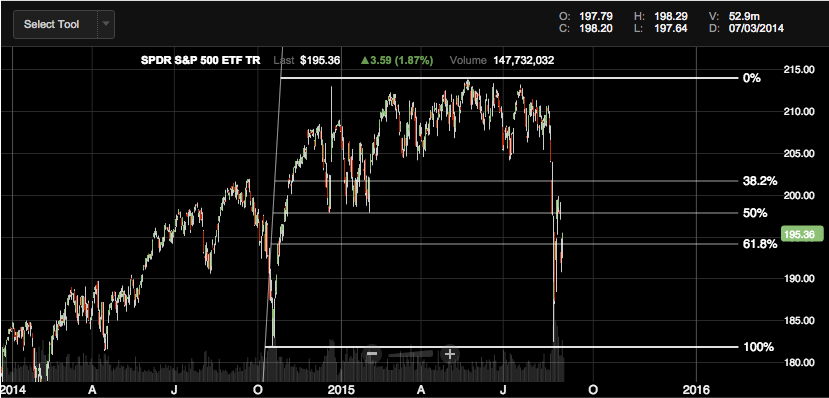
Superimposed on the chart above is the Fibonacci technical indicator. In yellow is a horizontal line showing, what I think, is going to be the point at which the market bottoms for good. On the way down from roughly 2100 on the S&P, we have hit support at 38.2%, 50% and mild support at 61.8% retracement. It is important to note that the superimposed Fibonacci is showing a 100% retracement at the October low, and is not drawn from the market peak in August. This makes me believe that we may see 1821 on the S&P and bottom. Confirmation of this as a bottom would be if the RSI continues to see resistance at the downward sloping trend line. All bets are off for a 1821 bottom if the RSI convincingly crosses above the RSI trend line. You can see above how there have been occasions on which the RSI has broken through the trend line, but shortly thereafter got punched below it. I would wait to see the RSI hold above the trend line for about one week before buying, should this happen before the S&P 500 reaches 1821. If the RSI crosses above the trend line as the S&P 500 nears 1821, then I would be pretty confident in doing a whole lot of buying. I really hope you used today's rally to get better exit prices for the stocks you currently hold. I think the markets aren't done going down. Concerns over the strong dollar, low oil and China fundamentally say that we're not ready to make our way high. From the technical side of things, there's no sustainable rally in sight. Above are four charts I put together, each with a technical indicator superimposed. The first a trend line from the 2009 bottom. In 2011, when the markets experienced a similar correction, the S&P 500 pulled back to this trend line. In the most recent violent correction, we failed to reach this trend line. I think that we will retest the lows we saw last Monday (I will explain why in a second) and then some. The second picture shows the S&P 500 with the RSI and stochastics on the bottom. With an RSI of approximately 40 and stochastics that say we are not yet oversold, I think that there is still room for downside. The third and fourth pictures (bottom left and right) show how the markets have been trading in lockstep with the Fibonacci ratios I always talk about. I superimposed the technical indicator from the high in May to the October low. This shows how we did not reach a 100% retracement from the high, further leading me to believe that we will see a little more downside than we saw before, before we reach an investable bottom.
So what does this all mean? I think the SPY will retest $182 in the near future. I bought the September 18 $185 Put, and you should think about doing the same, even if it's a hedge against your portfolio. Read: How To Profit From The Trends That Teenagers Actually Like, Part 3 Of 3 |