|
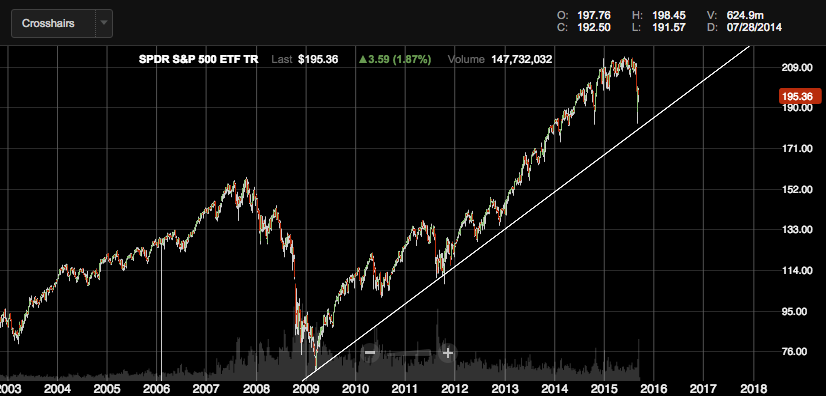
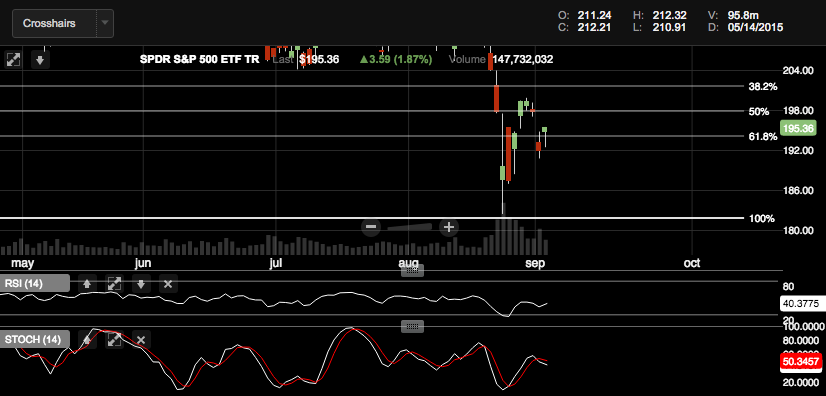
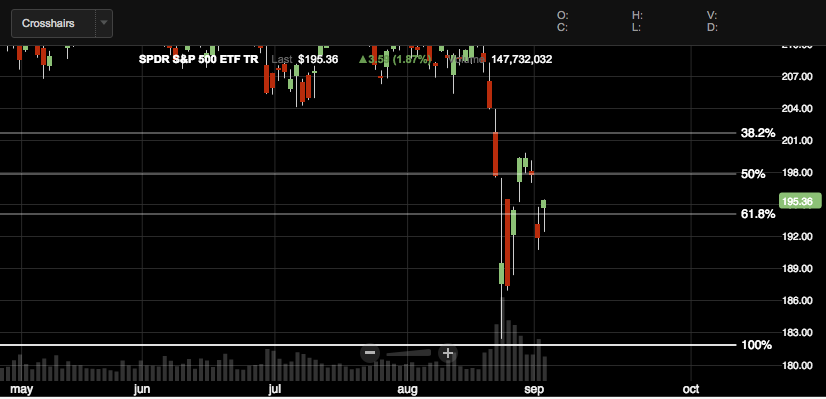
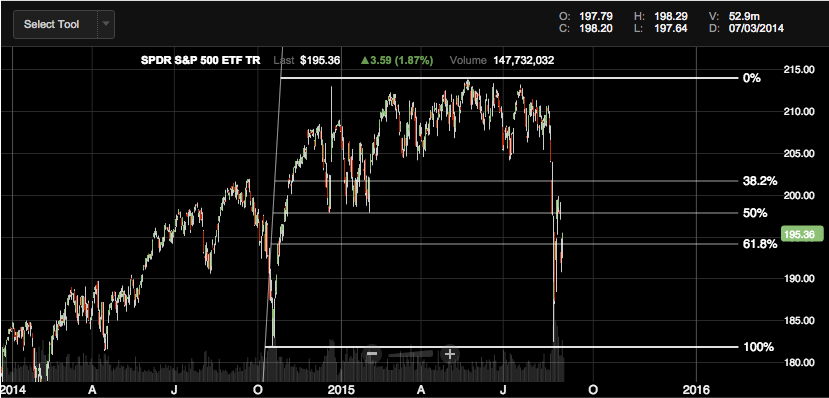
I really hope you used today's rally to get better exit prices for the stocks you currently hold. I think the markets aren't done going down. Concerns over the strong dollar, low oil and China fundamentally say that we're not ready to make our way high. From the technical side of things, there's no sustainable rally in sight. Above are four charts I put together, each with a technical indicator superimposed. The first a trend line from the 2009 bottom. In 2011, when the markets experienced a similar correction, the S&P 500 pulled back to this trend line. In the most recent violent correction, we failed to reach this trend line. I think that we will retest the lows we saw last Monday (I will explain why in a second) and then some. The second picture shows the S&P 500 with the RSI and stochastics on the bottom. With an RSI of approximately 40 and stochastics that say we are not yet oversold, I think that there is still room for downside. The third and fourth pictures (bottom left and right) show how the markets have been trading in lockstep with the Fibonacci ratios I always talk about. I superimposed the technical indicator from the high in May to the October low. This shows how we did not reach a 100% retracement from the high, further leading me to believe that we will see a little more downside than we saw before, before we reach an investable bottom.
So what does this all mean? I think the SPY will retest $182 in the near future. I bought the September 18 $185 Put, and you should think about doing the same, even if it's a hedge against your portfolio. Read: How To Profit From The Trends That Teenagers Actually Like, Part 3 Of 3
0 Comments
The S&P 500 is flirting with its 200 day moving average. As of today, the 200 day sits at 2072.58 and at the time of this post, the S&P 500 is at 2079. 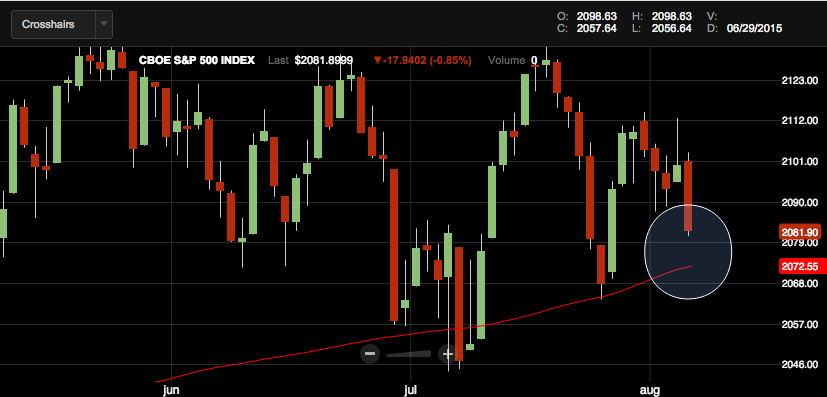 I wanted to alert my readers about the possible fair value and moving average divergence. If this happens - and this could be a reality given the jobs report tomorrow, August 7th - don't panic right away. The S&P 500 has crossed below its 200 day moving average multiple times in the past, without falling further below in the following days. It is important to note when the S&P 500 crosses below the 200 day, and it is equally imperative to stay attentive during the following days. If the S&P 500 is unable to break above the 200 day moving average within 6 days, then panic. I think that if the S&P is unable to stay above its 200 day moving average, there will be a lot more downside. I think the S&P 500 will not see any support until the 2030s, which is shown on the superimposed trend line on the picture below. 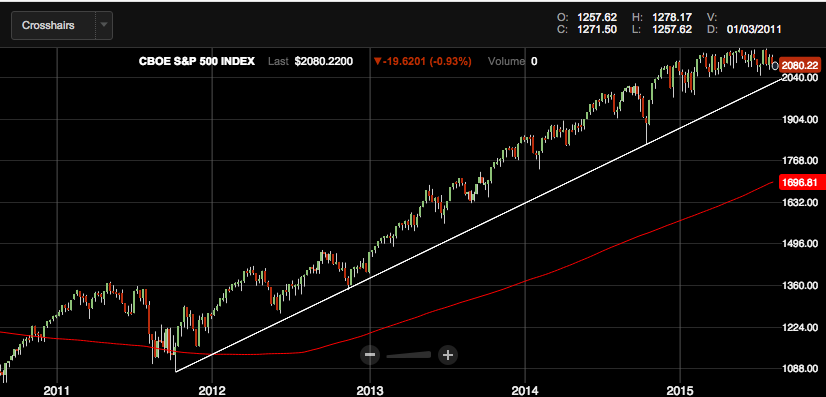 |