|
Do you check the volume of a stock before you pull the trigger? If the answer is no, then you should. Volume can show the direction of a trend in the same manner as price action (the day-to-day price changes of a security). As you probably know already, volume can be found at the bottom of a stock's chart. With that said, just because it is located at the bottom doesn't mean you shouldn't pay attention to it. Volume Is Like Gas Volume can tell a lot about the future momentum of a stock. Think of it like gas. In order for a car to drive a long distance, it needs a full tank. In terms of the stock market, this means that in order for an upward or downward trend to continue, the volume must be present. Without gas, or volume, neither the car nor the stock will go anywhere. While it's true that a stock can trade up or down without heavy volume, trends are confirmed or denied based on the action of the volume. Let's compare two stocks, ABC and XYZ. Stock ABC has gained 5% in three sessions, but traded half as many shares as normal each day. On the other hand, stock XYZ gained 3% over the same three sessions, but each day traded three times its average volume. Which will most likely be higher a week from now, all else being equal? Most likely stock XYZ. This is because there is a negative divergence -- a contradiction between two indicators -- between stock ABC's price movement and volume. To confirm or deny a trend, you want a stock's price movement and volume to move in tandem. It's Confirms Patterns, Too Volume doesn't usually lie, and it can legitimize price patterns. I'll put my previous point and this one together to illustrate the importance of volume. For this, I'll use a head-and-shoulders pattern as an example. (If you've yet to see my piece on Apple's (AAPL) head-and-shoulders pattern, I'd recommend reading it here). 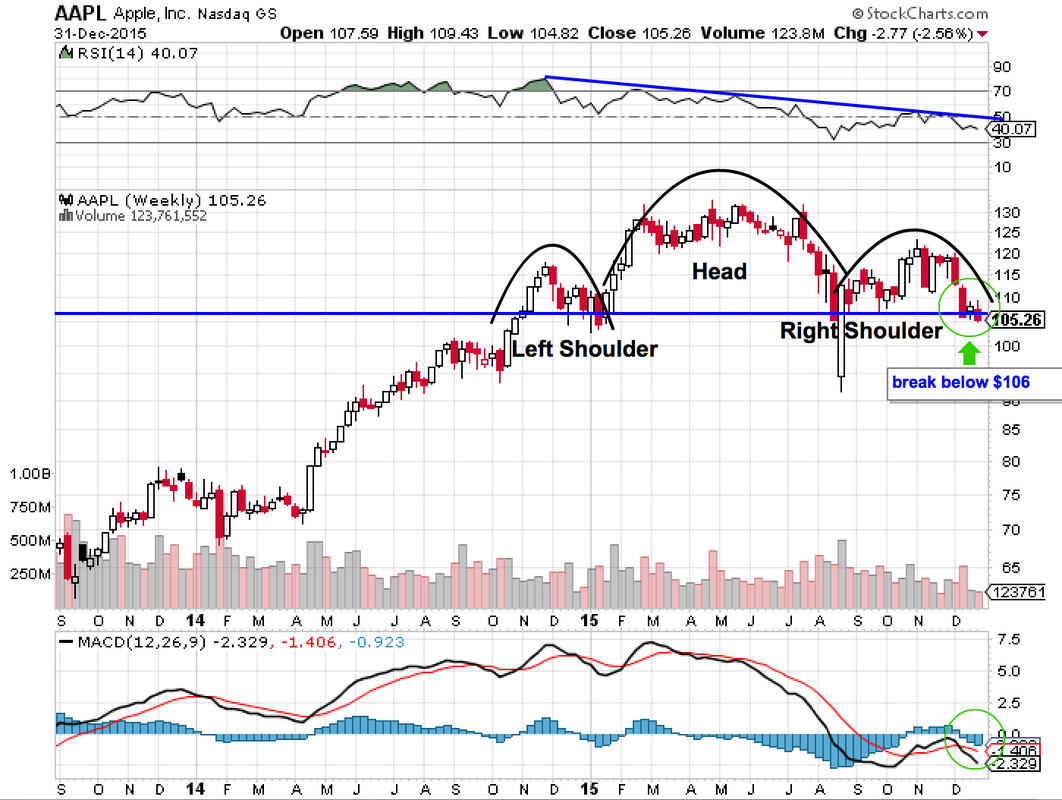 The head-and-shoulders pattern, shown above along with other indicators, is a sign of a stock's good times coming to an end. Apple's recent chart action serves as a great example of how volume can be used to confirm a trend. Notice how every time Apple attempted to make a new high -- the left shoulder, head, and right shoulder -- it was rejected soon after. Now notice the volume. You can see how there was a divergence between Apple's increasing price and declining volume each time it tried to make a new high or break through an old one. The repeated rejection and divergence confirms the bearish direction. Thus, after the fact, it should surprise no one that Apple is trading near $95 a share, off approximately $40 from its high in April of last year. While the above example outlines a pretty textbook scenario, stocks exhibit this behavior more often than you might think. So, before you click "submit" on your next trade, ask yourself: Did I check out the stock's volume?
Up Next: Why Does Technical Analysis Work?
0 Comments
Leave a Reply. |