|
Apple (AAPL) didn't do so hot in 2015; the stock's rollercoaster ride amounted to nothing of substance for shareholders. Despite some promising quarters and a dirt cheap valuation, it seems as though Apple investors are still not pleased. While no one knows for sure what the fundamental future looks like for Apple, traders are pointing to the technicals and making a pretty sure bet that it will be gloomy.
Over the last year or so, the only thing that Apple managed to do was carve out a textbook head-and-shoulders chart pattern. In November and December of 2014, Apple traced -- what we now see as -- the left shoulder of this bearish chart pattern. From February to July of 2015, Apple failed to breakout above $135 and completed the head of the pattern. Then, Apple proceeded to shape out the right shoulder from April to December of this past year, completing the ominous head-and-shoulders pattern. An annotated picture of the pattern is shown below. 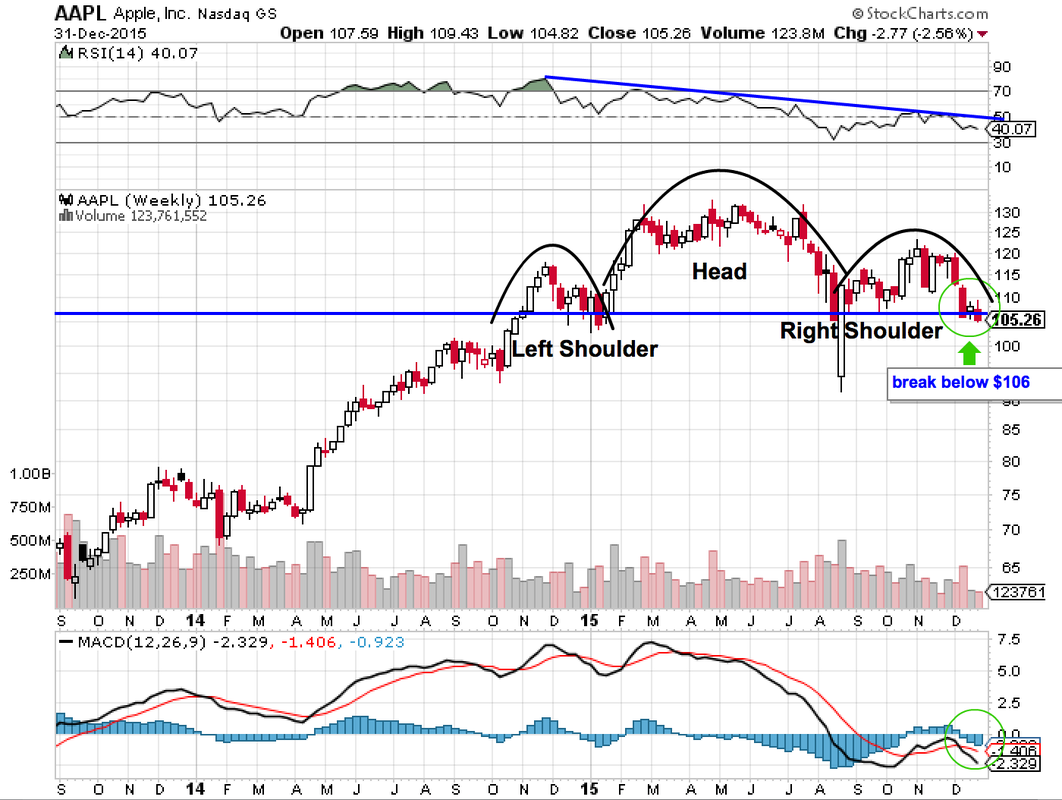
Notice the symmetry on this weekly chart. AAPL was consistently bouncing off a floor of $106, with the exception of the flash-crash in August. The symmetry lends itself to the strength and reliability of the chart. Because AAPL bounced off $106 numerous times, we know that this is a strong floor of support and will prove to be a strong ceiling of resistance going forward.
It is worth noting that the MACD is suggesting that you sell the stock, and the RSI is still trending downward. These indicators suggest that negative price action is on the horizon. While we may see APPL trade sideways or even go a little higher in the near future, I still think that the chart points downward. I suggest staying clear of Apple or even shorting it if the technical breakdown continues. At the time of writing Apple traded at $105.52, obviously below $106. I will be watching this level carefully in the coming days. If Apple is unable to clear $106, I believe that, over time, the stock can test previous resistance of $76. Expect more coverage of Apple in the coming weeks.
0 Comments
The inverse head and shoulders pattern is one of the most reliable patterns I have ever come across. This pattern signals a reversal of a current uptrend, just as a head and shoulders pattern signals the end of an uptrend. It is formed by a new low (the left shoulder), an even lower low (the head), and a return to the previous price level (the right shoulder). Together they form what looks like a person doing a headstand. See below for an example, and then continue reading for 10 stocks that are forming or have formed an inverse head and shoulders pattern.
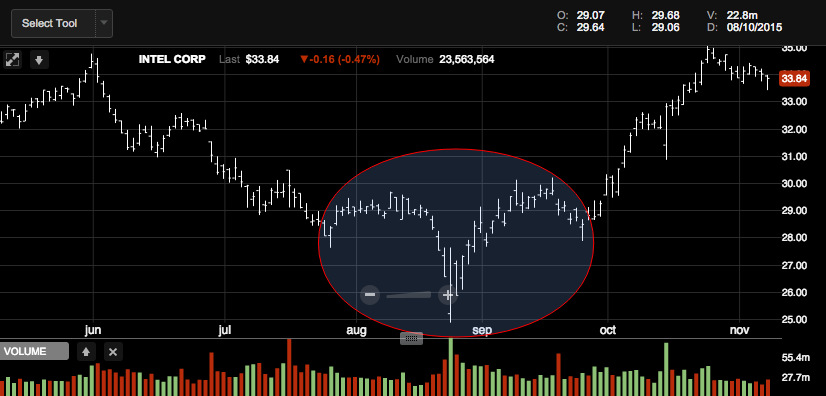
Intel Corp. (INTC) inverse head and shoulders chart pattern.
The stock chart above is Intel (INTC), and it is a perfect example of a textbook inverse head and shoulders pattern. There are 7 key things that are happened before Intel broke out. (1) INTC was in a previous downtrend. (2) The left shoulder formed as the result of testing a new low. (3) The head made a low visibly lower than the left head. (4) The right shoulder saw resistance at the apex of the left shoulder. Note: This is not a requirement for an inverse head and shoulders chart pattern. The apex of the right shoulder can be, and often is, lower than that of the left shoulder. You will see this occur in many of the chart patterns below. (5) The low of the right shoulder was almost in line with that of the left shoulder (look on the leftmost and rightmost parts of the eclipse to see what I am referring to). Note: This is not a requirement for an inverse head and shoulders chart pattern. The low-point of the right or left shoulder can be lower than the other. However, it gives confirmation to the pattern if the two are close to being of equal value, like in the example above. (6) There was a throwback, or the period of consolidation after the pattern's completion and before the stock's breakout. Look at the three bars that occurred in late September and early October -- these are not always required, but it is healthy for the stock as it eliminates a parabolic price increase.
Let's pretend that it's late September and the inverse head and shoulders pattern just completed its formation. How do we set and exit price target? It's quite simple. All you have to do is subtract the value of the low-point of the head from the value of the apex of the higher shoulder. So, for Intel, that would mean subtracting $25 from $30, yielding a difference of $5. This is how much upside you can expect to get from the trade. Sure enough, in the coming month Intel rallied from the throwback price of $30 all the way to $35. This was an incredible 16.6% increase in a single month! While it's nice to see how and why the above trade worked out, traders always have to be on the lookout for the next one. So, without further ado, here are 10 stocks (ranked in order of quality) that have or are forming inverse head and shoulders chart patterns. See if you can spot the inverse head and shoulders patterns! (1) Eli Lilly (LLY) (2) Gilead Sciences (GILD) (3) Murphy Oil (MUR) (4) WhiteWave Foods (WWAV) (5) Apple (AAPL) (6) Whole Foods Market (WFM) (7) Macy's (M) (8) Kroger (KR) (9) Ulta (ULTA) (10) Honeywell (HON) |

 RSS Feed
