|
At its most recent low just a few weeks ago, Procter & Gamble (PG) was down 27% from its all time high. Like almost all of the stocks in the market, this one has seen better days. With that said, however, P&G seems to have bottomed and formed a bullish chart pattern. 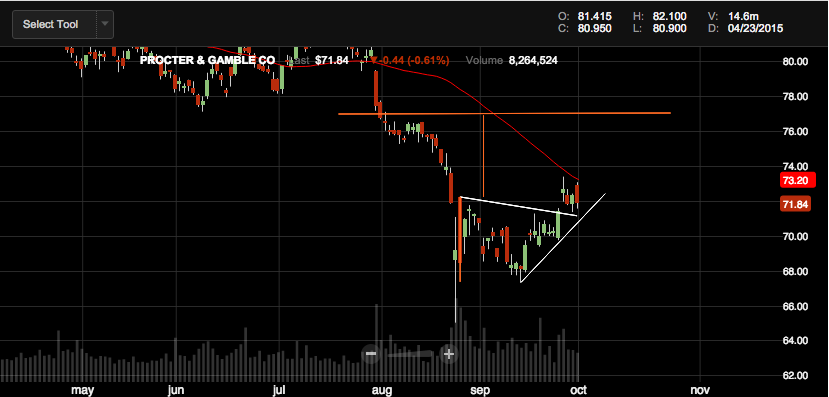 One of the most common patterns is one called the "Head and Shoulder's" (ironic, isn't it?) pattern. Lesser known is its inverse, appropriately called a "Reverse Head and Shoulders." If you look at the chart of P&G, you can see what looks to be a person doing a headstand. The left shoulder is higher than the lowest portion of the "upside-down head," and the right shoulder is also above the head. Drawing a segment from the top of the left shoulder to the top of the right yields our entry point. The pullback from the right shoulder is known as a "throwback" and is a retest of this support/resistance line. You can see that P&G tested this line a few days ago and held, which makes me believe that more upside is to come.
How much upside? This question can be answered by measuring the height of the pattern. Drawn in orange is one segment that measures the height of the pattern (from the top of the left shoulder to the bottom of the head), and the projection of that measure. The pattern measures about $4.80, which yields a near term price target of just about $77, or about 7% upside from where P&G currently trades. The stock's main resistance currently comes in the form of the 50 day moving average, shown in red. If it can break through that, I think it should serve as a strong floor of support going forward. Even if the broader market has not bottomed/is not done going down, (1) that does not mean that P&G cannot go up, nor does it (2) mean that it has to go down. P&G has a relatively low beta, meaning it is not very volatile, thus making it a decent stock to hold during these uncertain times. All in all, however, I think if you're looking for a high yielder with a decent amount of upside in the near term, P&G is your stock.
0 Comments
|

 RSS Feed
