|
Do-it-yourself home improvement retailer Home Depot (HD) has held up nicely amidst these rough times. I see a few things in the chart that make me believe that the good times can keep on rolling. 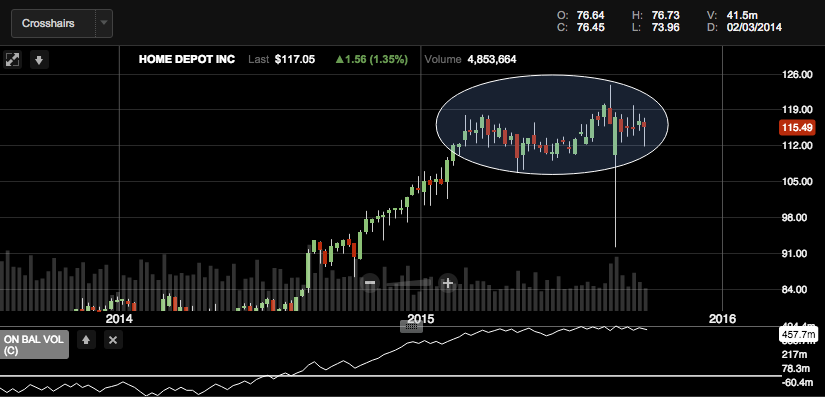 The weekly chart of HD shows a pretty clear cup and handle pattern. I've never seen a cup and handle formation so perfect; this one will be used in chart detection lessons years from now, and I think it is a good idea to profit from it now. This chart is the real deal.
Beginning around February, Home Depot began to consolidate. This is perfectly healthy, and something that HD has done multiple times during its six year uptrend. I predict - not accounting for any broader market meltdowns - that Home Depot will soon retest its all time high of $124 and march higher from there. The stock recently bounced off its 200 day moving average, and held its 50 day moving average today. These are two signs of strength. Another comes in the form of the On Balance Volume indicator, which is located in the bottom portion of the above picture. The On Balance Volume reveals that during the course of HD's consolidation, bulls were holding on strongly as the stock shook out the sellers. Now that the weak hands are gone, HD can begin to make its way higher. In addition to sound technicals, Home Depot yields 2.00%, or $2.36 per share. The company increased its dividend by 25.5% from 2014 to 2015, and with its most recent quarter beating estimates, it is probable that the dividend will continue to increase over time.
2 Comments
|

 RSS Feed
