|
Mannkind is one of those companies that is always in the news for the wrong reasons, and attracts investors that only seem to lose money. However, I went back all the way to 2011 to find something that MNKD almost always does before it spikes up; something that you could easily take advantage of if you keep a watchful eye.
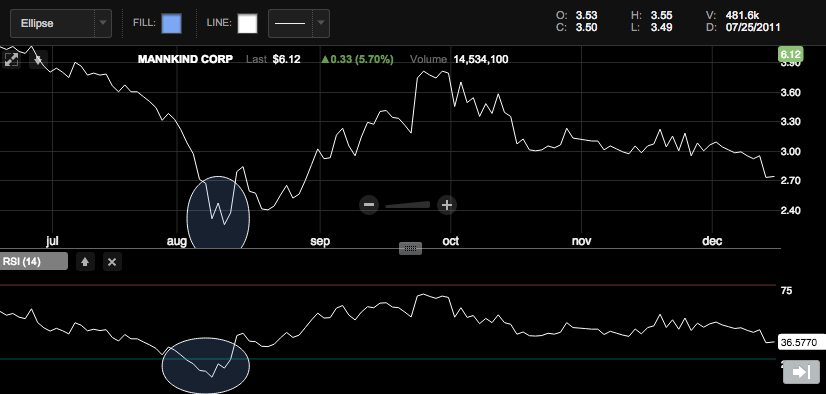
The bottom part of the picture shows the RSI, or Relative Strength Index. This is a tool often used by investors to determine when a stock is overbought or oversold. If the graph of the RSI is above 75 (the red line), many investors see the stock as being overbought. On the contrary, investors often see a stock as being oversold if the RSI is below 25 (the blue line). The picture above shows the chart of MNKD in 2011. As you can see, shortly after it was deemed oversold, the stock began to tick upwards. See it happen again in the picture below.
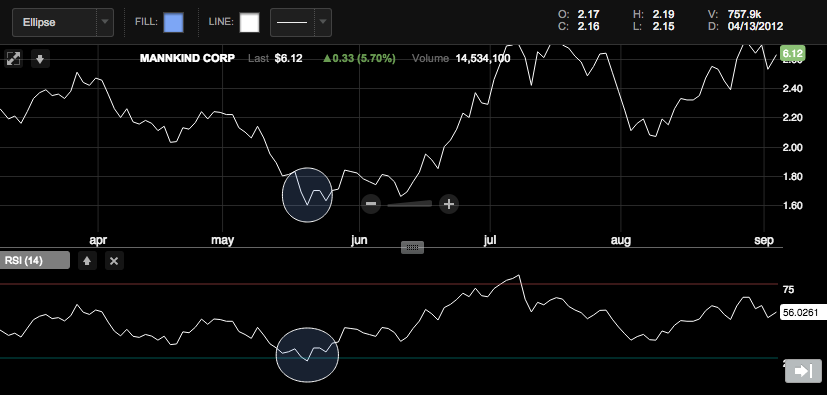
And again.
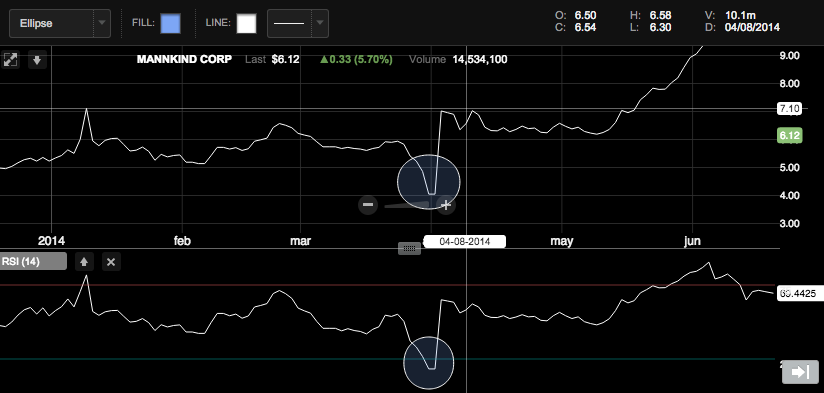
And again.
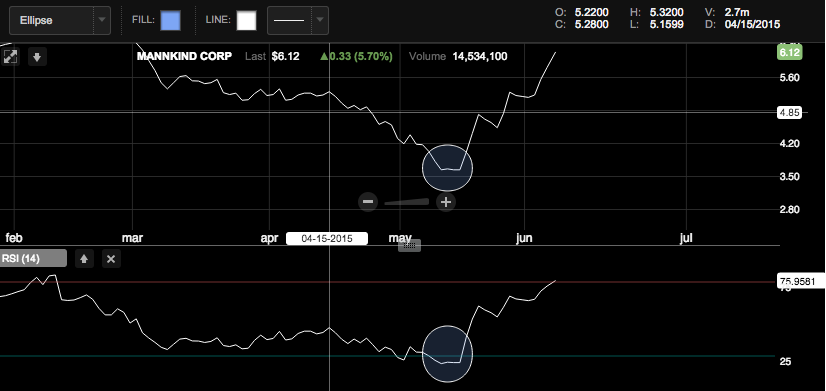
And again! Okay, that's enough.
Conclusion: MNKD has proven time and time again to be a stock that trades heavily off its relative strength. Use this to your advantage by keeping an eye out for it, and buying some shares only when the RSI dips below 25. Not 26, not 25.5, but 25 exactly, for it has shown on multiple accounts to trade sideways or down until it is fully below 25.
0 Comments
|

 RSS Feed
