|
With a lid at about $79 and a sloping floor, TAP has been trading sideways for about a year. However, it has been consolidating into what I consider one of the most bullish charts there is. As I've noted in previous charts such as Facebook and Direct TV, a stock with a sloping floor and horizontal ceiling are often poised for a breakout. A lot of people know that. But, what a lot of people probably have not found is something that I have, and something that I have mentioned in a few posts: these stocks tend to breakout just after they successfully hold their 50 day moving average. TAP lost just about 3% today, which caused it to breakdown below its sloping floor support trend line. With this fall, it also broke below its 50, 100 and 200 day moving averages, shown in red, orange and blue, respectively. 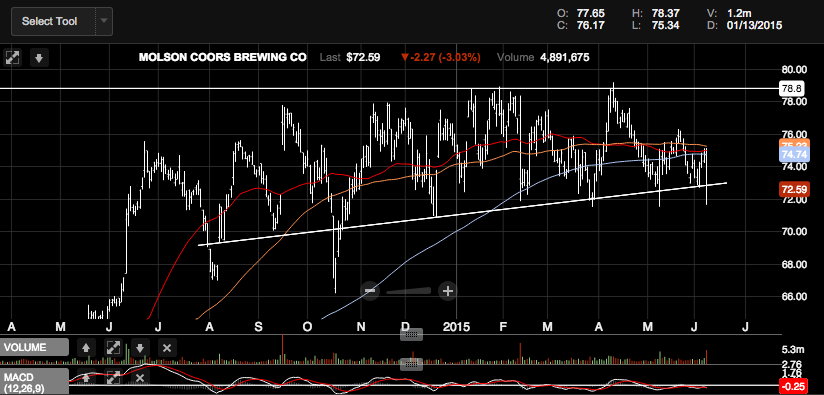 I would advise that you keep an eye on this stock, and if it is able to successfully hold its 50 day moving average, perhaps consider picking up a few shares and selling after it breaks out.
Please let me know what you think! Leave a comment below.
0 Comments
|

 RSS Feed
