|
Twitter (TWTR) has been an absolute mess since its IPO. After its most recent selloff, the stock seems to have reached a bottom at around $26.00. However, investors think that there is some good news in the cards for this blue bird. Here's why. 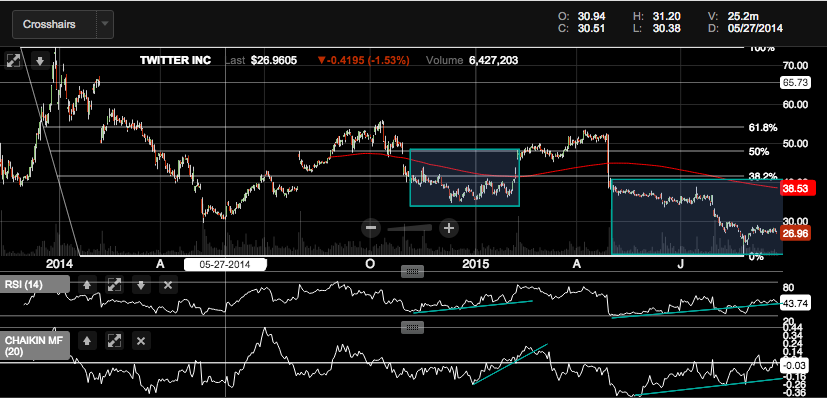 There's a lot going on in the chart above, and I'm going to break it down piece by piece. First, look at the chart of TWTR; more specifically, the segment highlighted in the second turquoise rectangle. It's no secret that TWTR shares have been plummeting but, like I said above, it seems to have reached a bottom at around $26.00. Secondly, the relative strength index, or RSI, has been gaining momentum throughout the downtrend. This is often a tell that there is a positive sentiment despite the stock's dismal performance. If you look at the rectangle in the middle portion of the picture and the corresponding technical indicators, you'll notice that TWTR did a similar thing back then, too. While the stock was declining, it was gaining relative strength. The Chaikin Money Flow index was also gaining momentum in this period. This is the third piece of the puzzle that tells me something good is about to come. The Chaikin Money Flow index is a measure of how money flows in and out of a stock. Though TWTR is currently trending downward, the money flow index has been gaining momentum. Lastly (this is not shown in the above picture), the weekly stochastics recently bottomed and are beginning to gain momentum. This positions TWTR for a long period of upside.
I think the best way to place a bet on a pop in this stock is through options. Also superimposed on the chart above is the Fibonacci ratios, and this is helpful in deciding which options to purchase. It is also beneficial to note that TWTR has a high level of resistance at $36. I believe this would be the first major point of resistance for TWTR, After this hurdle, resistance comes at $42 and $48. TWTR has been in its current downtrend for about six months, and this is a safe bet on how long it will take for the stock to approach these resistance levels. For TWTR to retest $36, the stock would have to gain 33%. That is no simple task, which is why it is reasonable to think that it will take a decent chunk of time before major strides are made. With this in mind, let's look out to the TWTR March 18, 2016 $36 call option, which trades at $1.30 or the TWTR March 18, 2016 $42 call option, which trades at $0.53. I think that either one is a nice way to place a directional bet on Twitter. Happy investing.
1 Comment
Update, June 11, 2015: This is a very good example of the stock chart telling you something that you wouldn't have known otherwise. Today, Twitter announced that CEO Dick Costolo will be stepping down. This is something that shareholders have long been waiting for, which is why the stock is up after hours. I think that the stock will see more upside tomorrow as investors see this as a time to buy a turnaround company, and shorts cover their positions. I hope you got in on this before the spike!
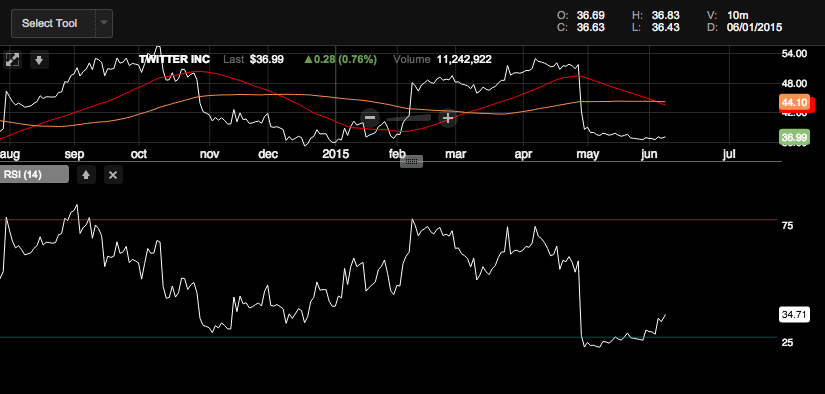
While I may have been wrong about Twitter in the past (I'll own up to my mistake), I wanted to point out the stocks RSI, which I believe is a bullish indicator amidst what has been nothing but turmoil for shareholders. Take a look below.
When the RSI rises from below 25 to above 30, many investors see this as a bullish bet for the stock. In the months of November, December and January, the RSI had been rising while the stock was trading sideways/slightly lower, kind of what it is doing right now. Though past performance does not necessarily ensure future performance, seeing as Twitter broke out after its RSI and stock were moving in opposite directions, it may very well do the same thing this time.
The stock is flirting with a pretty strong floor of support, so if you're willing to take a chance and pick up some shares, the upside could be very rewarding. |

 RSS Feed
