|
Greece is annoying. Because of this small country, the last few days haven't been the most investable (assuming you're long the market), seeing as Monday was a bloodbath and Tuesday was a choppy trade. However, amidst the turmoil there remains one true tell of the severity of the situation: Facebook.
How could this be, you might ask - that one single stock can show the seriousness of this worldly event? Well, FB is a stock that heavily trades off technical indicators. Through it took a hit along with the rest of the market, its technicals remain in tact, which is why, right now, I believe it is safe to say that everything is okay. However, if Facebook breaks its resistance level, it may be time for the bulls to go into hibernation. To start, take a look at the picture below, which shows Facebook's chart over the last six months or so. There's a lot going on here, but I'm going to break it down into four key points that show why this one stock can be your window into the status of the overall market. 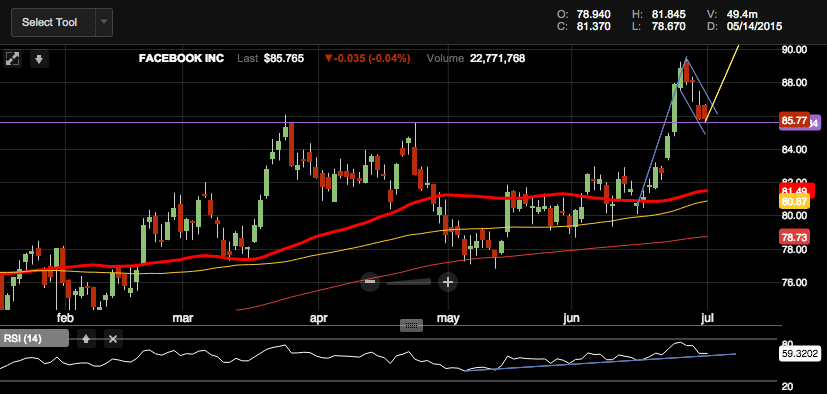
1. In mid-June, Facebook cleanly broke away from its 50, 100 and 200 day moving averages, once again finding support at the 50 day moving average right before breaking out. Please read some of my other posts which show time and time again how this is a fantastic entry point for a stock that has been trading sideways. Self promotion aside, the stock now sits at 85.77, which leads me to point number two.
2. The horizontal line, in purple, shows Facebook's current support level, which in both late-March and late-April served as a strong resistance level. As I previously mentioned, FB finally broke out and consolidated to the support level at $85.59. Though volatile in Tuesday's trade, Facebook found support for the second straight day at this key level. But wait, there's more! How to profit from the top 3 trends that teenagers actually love. 3. This breakout and subsequent consolidation has created a bull-flag, which is outlined in the blue segments. In short, a bull-flag is created when a stock runs up, then - in textbook terms - consolidates for at least three candlesticks before making its next leg higher (The picture above is a daily chart, so each candlestick is one day). Seeing as Facebook again found support at the $85.59 level, I think the stock is done consolidating and is instead ready to drift higher. How much higher? I think to $95, which is 11% above the current price. I derived a price target of $95 from taking the 11% percent gain obtained in the flagpole segment of the bull-flag and doing a little math. The yellow line showing the new flagpole is cutoff, but hey - I like when my money is off the charts. 4. The last point that I want to touch upon is the performance of Facebook's RSI over the last two months. As the stock was consolidating from mid-April to mid-May, its RSI was converging, which is very bullish. Since mid-May, when the RSI bottomed, it has been making higher highs and higher lows - another bullish indicator. Notice once again how FB's price and RSI were converging as the stock made its way from almost $90 to $85.59. This gives me another reason to believe that Facebook is still very strong, despite what has been going on everywhere else. How to play this stock that just had a huge earnings beat. Conclusion: The reason why Facebook can be used as a metric for the broader markets is that it has the most sound technicals. Therefore, if FB holds $85.59, I say that the worst is over and it is safe to buy the market (and the first thing you should buy is FB). However, if FB is unable to hold the key support level, I see it, along with the overall market, plummeting even more. In the latter scenario, wait until Facebook bottoms to do any buying. At a glance I would say that it bottoms at its 200 day moving average. Note: On Tuesday I bought the July 17 $88 calls for $1.23. Once the bloodshed is over, Facebook should bounce back with a vengeance and at least recapture its high (which would put the calls in the money). The momentum is with this name, and I would not bet against it. If you don't want to place a buy order for an $86 stock, do as I did any buy call options - you can get in the same trade I did for around $100. With the potential upside and defined downside, I don't think you could go wrong doing that.
0 Comments
|

 RSS Feed
