|
Netflix (NFLX) is up a whopping 132% year-to-date. After its Q2 earnings report, the stock exploded, gaining another 15 or so points. If you missed the stock's monstrous run (like I did), fear not. I see a good amount of upside in the name.
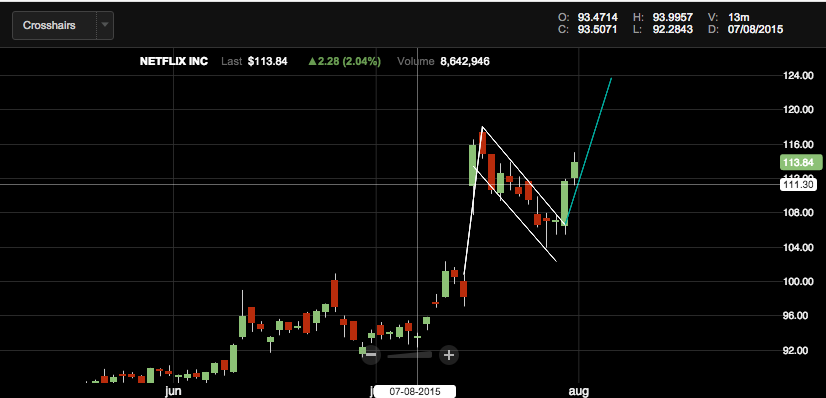
Superimposed in the chart above is a bull-flag that I spotted, created from the pop after Netflix's earnings. I find the bull-flag chart pattern to be the most reliable of them all. Typically, a stock-moving event such as positive earnings/outlook will make the stock pop. In the following days, it isn't uncommon to see profit taking. The combination of these actions is what creates the rise in the underlying share price and the subsequent pullback. A textbook bull-flag will see a stock's price decline for at least two to three candlesticks before resuming its uptrend. The chart above is a daily chart, so each candlestick represents one day.
When you think about it, it makes a lot of sense that a company with positive earnings/outlook can keep on running. After the sellers are exhausted, there is nothing holding the stock back. After all, nothing about the company has changed. While there may be macro resistance, there will be no stock-specific resistance. With bull-flags, it is easy to estimate an exit-price for your trade. This is arguably the most important thing to consider when initiating a position. To estimate an exit-price, use the height of the flag-pole, which in the above picture is superimposed as the tall, white segment, and create another segment of the same magnitude. This time, however, drawing it from the base of the flag. In NFLX's case, the flagpole created from its earnings report was $17.23. The base of the flag (after selling) was about $106.50. To get the exit-price, add the two numbers together to get $123.73. This share price represents a gain of roughly 8.5%. I see no reason why NFLX cannot be trading at this price in the not-too-distant future.
0 Comments
It seems as though Netflix will trek lower. Unlike a double bottom, a double top in a stock often means the end of a good run; and boy, has Netflix had a good run (in 2003 it traded under $2.00). What does this mean for you? Well, the company reports earnings on April 15th, and if, by chance, investors are happy with the numbers, it will almost certainly take out the old highs, and $484 will become a new floor of support. However, if investors are not happy with what they hear (most are not interested in the earnings or revenue, but instead about the subscriber count, hours watched etc.), then the stock will most likely begin to trade back down to the $320s.
Update: Investors were VERY happy with Netflix's earnings. The stock is up 10% in the after hours! It looks as though $484 is a new floor. 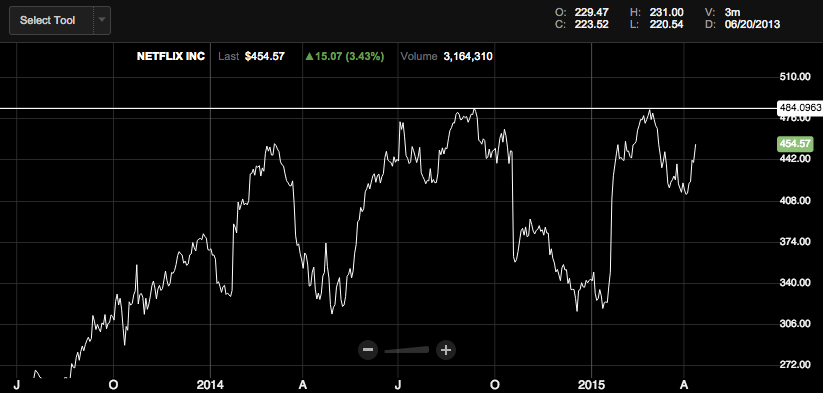
NFLX double top at $484.
|

 RSS Feed
