|
Last night I did a little digging and found that 19 out of the 30 Dow stocks have formed or are currently forming head-and-shoulders patterns. Remember that these Dow stocks compose not only the Dow itself, but are also large components of the S&P 500 (and some are a part of the Nasdaq). We've already seen Apple (APPL) bite the dust after its head-and-shoulders pattern, and I think that the next to go is 3M (MMM). Fundamentally, 3M is falling victim to a global slowdown in industrials -- the recent data has not been in the company's favor -- and the rising dollar. Being a multinational company based in the United States, 3M makes less money when it converts is revenues to the greenback. Thus, the company has to sell more and manage costs more effectively to meet revenue and profit expectations for the quarter. So on this front alone I wouldn't be buying 3M here. The technical side of things paints a similar picture. When the fundamentals and technicals of a stock seem to be moving in tandem, it often strengthens the underlying thesis. 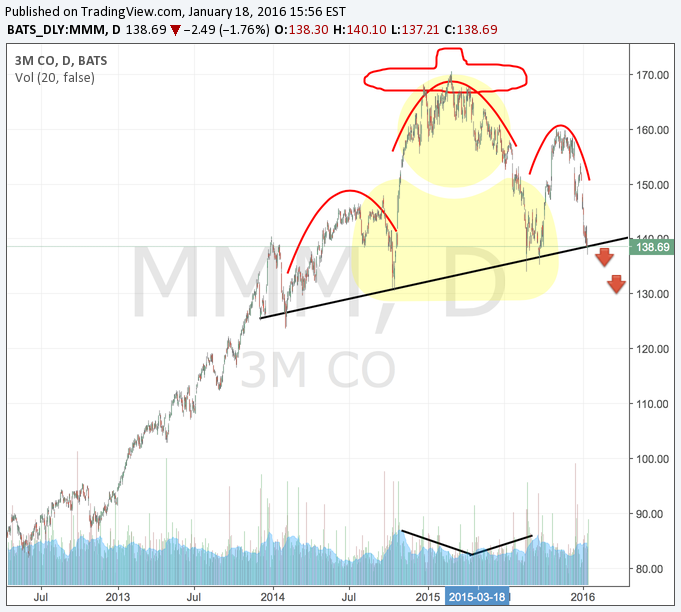 3M Head-and-Shoulders Chart Pattern Above is a daily chart of 3M. (Oh, by the way: you can create charts like these by clicking the "Charting Now" tab on my page. I guarantee you that this charting software offers more features than what you're currently using). You can see that there is a sloping trend line which serves as the neckline of this chart. Think of this line as a piece of wood. The more you hit a piece of wood with a hammer, the weaker it gets. Well, 3M has hit this piece of wood multiple times, making it weaker and weaker with each pound. In the last two years, 3M has bounced off this support line six times. At the time of writing, 3M currently sits at that trend line; however, this time I don't think it will hold. 3M's volume over the last 18 or so months leads me to believe that we will see lower prices before higher ones. If you missed my piece on the importance of volume in technical analysis, I highly suggest reading it. It really makes a difference in future price action.
Notice how 3M's volume during the formation of the head diverges from the price action; in other words, the price keeps going up as the volume declines. This is a big no-no. Furthermore, during the decline from the head to the right shoulder, volume increased, which confirmed the bearish sentiment. My price target for 3M shares is $110, but I don't think we will see this price for a few months. I derived this price target by subtracting the price at the violation of the neckline (which I think will be around $140) from the head's price of $170. This is a difference of $30, which can be projected downward to yield a target of $140-$30 or $110. In my opinion, the market will trade sideways or slightly higher in the near term, allowing many other Dow names to complete the right shoulder of their head-and-shoulders patterns. But when this happens, 3M will be the first to go. Up Next: 10 Qualities That Successful Traders Have And You Don't
0 Comments
Leave a Reply. |

 RSS Feed
